
Reports and dashboards / Reports and dashboards
Build and reuse a report
Select accessible data, configure a saved view, then share, export, schedule, or place it on a dashboard.
Before you start
Open Reports from the workbench. You can only select data and saved reports that you are allowed to read. Sharing and scheduling are available only when those actions are available on the report.
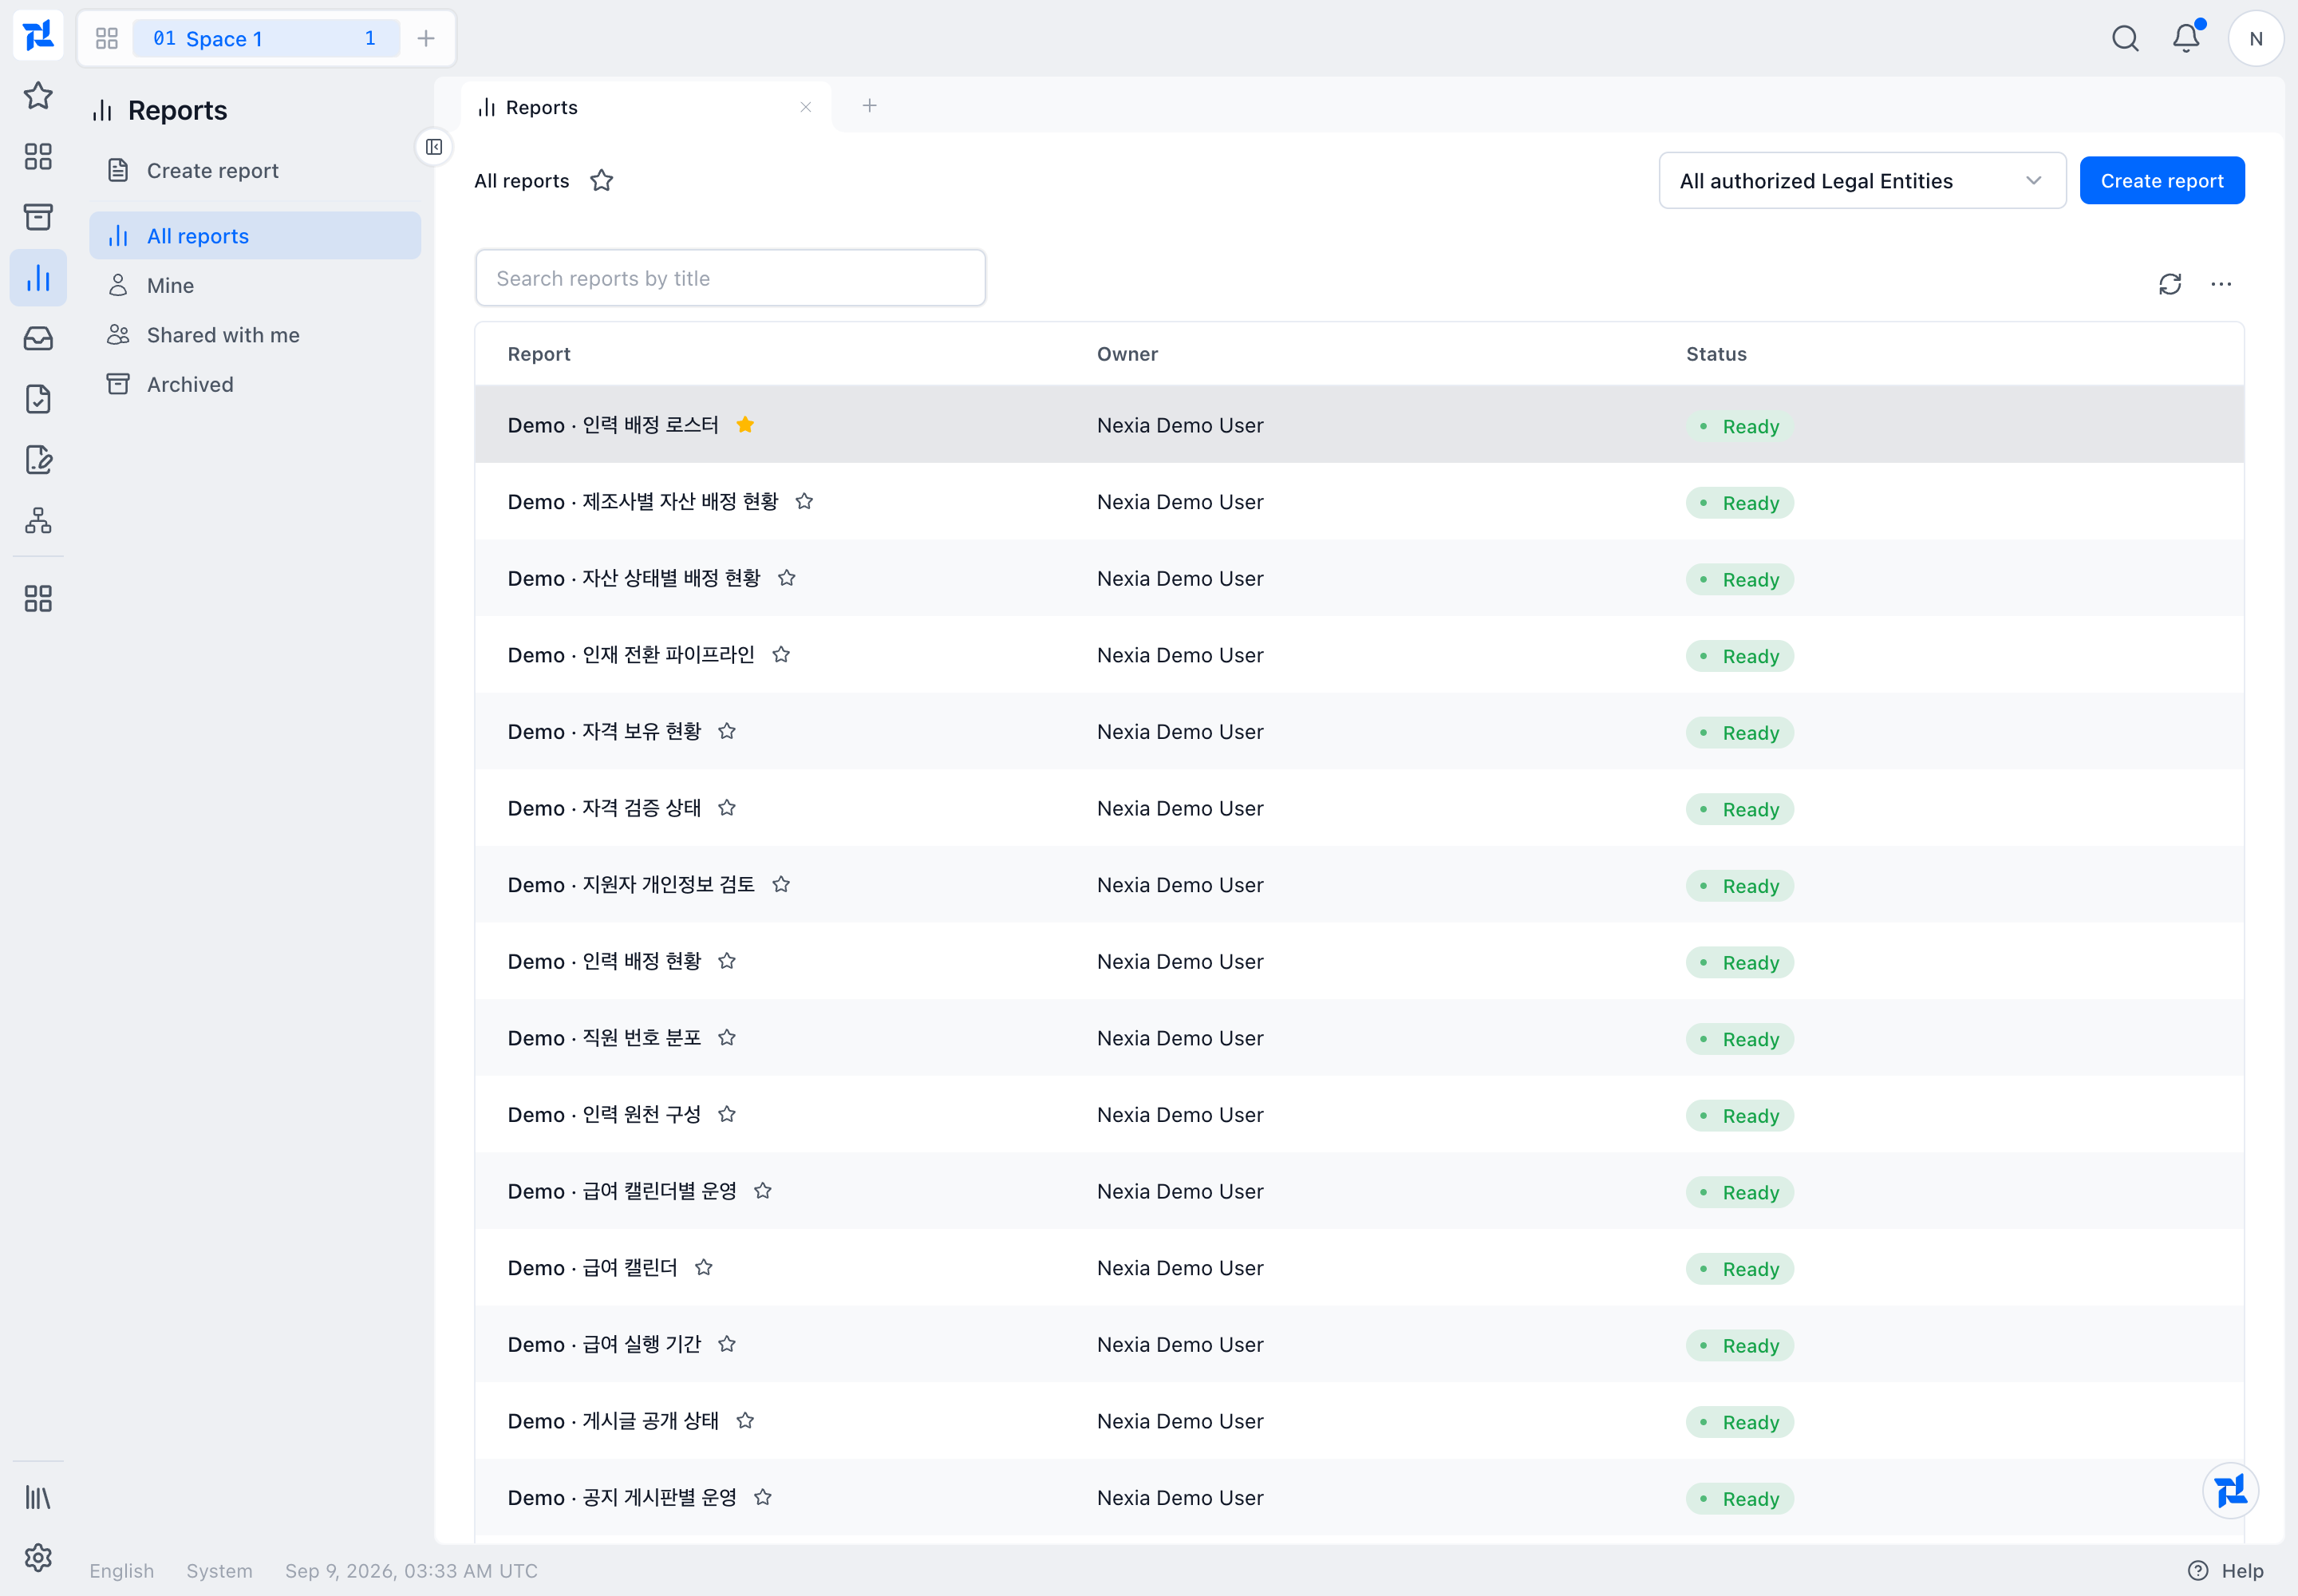
Find or create a report
Search the library, choose Mine, Shared with me, or Archived, and narrow it by Legal Entity when that selector is available. Select a report title to reopen it. Choose Create report to start a new saved data view.
Configure and save the data view
- Enter a recognizable title, choose the Analysis scope, then choose Business data.
- Use Conditions and Add condition or Add condition group to narrow the result when needed.
- Use Compare by and Add comparison for an available breakdown. Check Measures and its Calculation before continuing.
- Choose Preview. Check the source, scope, conditions, breakdown, and totals.
- Choose an offered Presentation after the preview, then choose Save report.
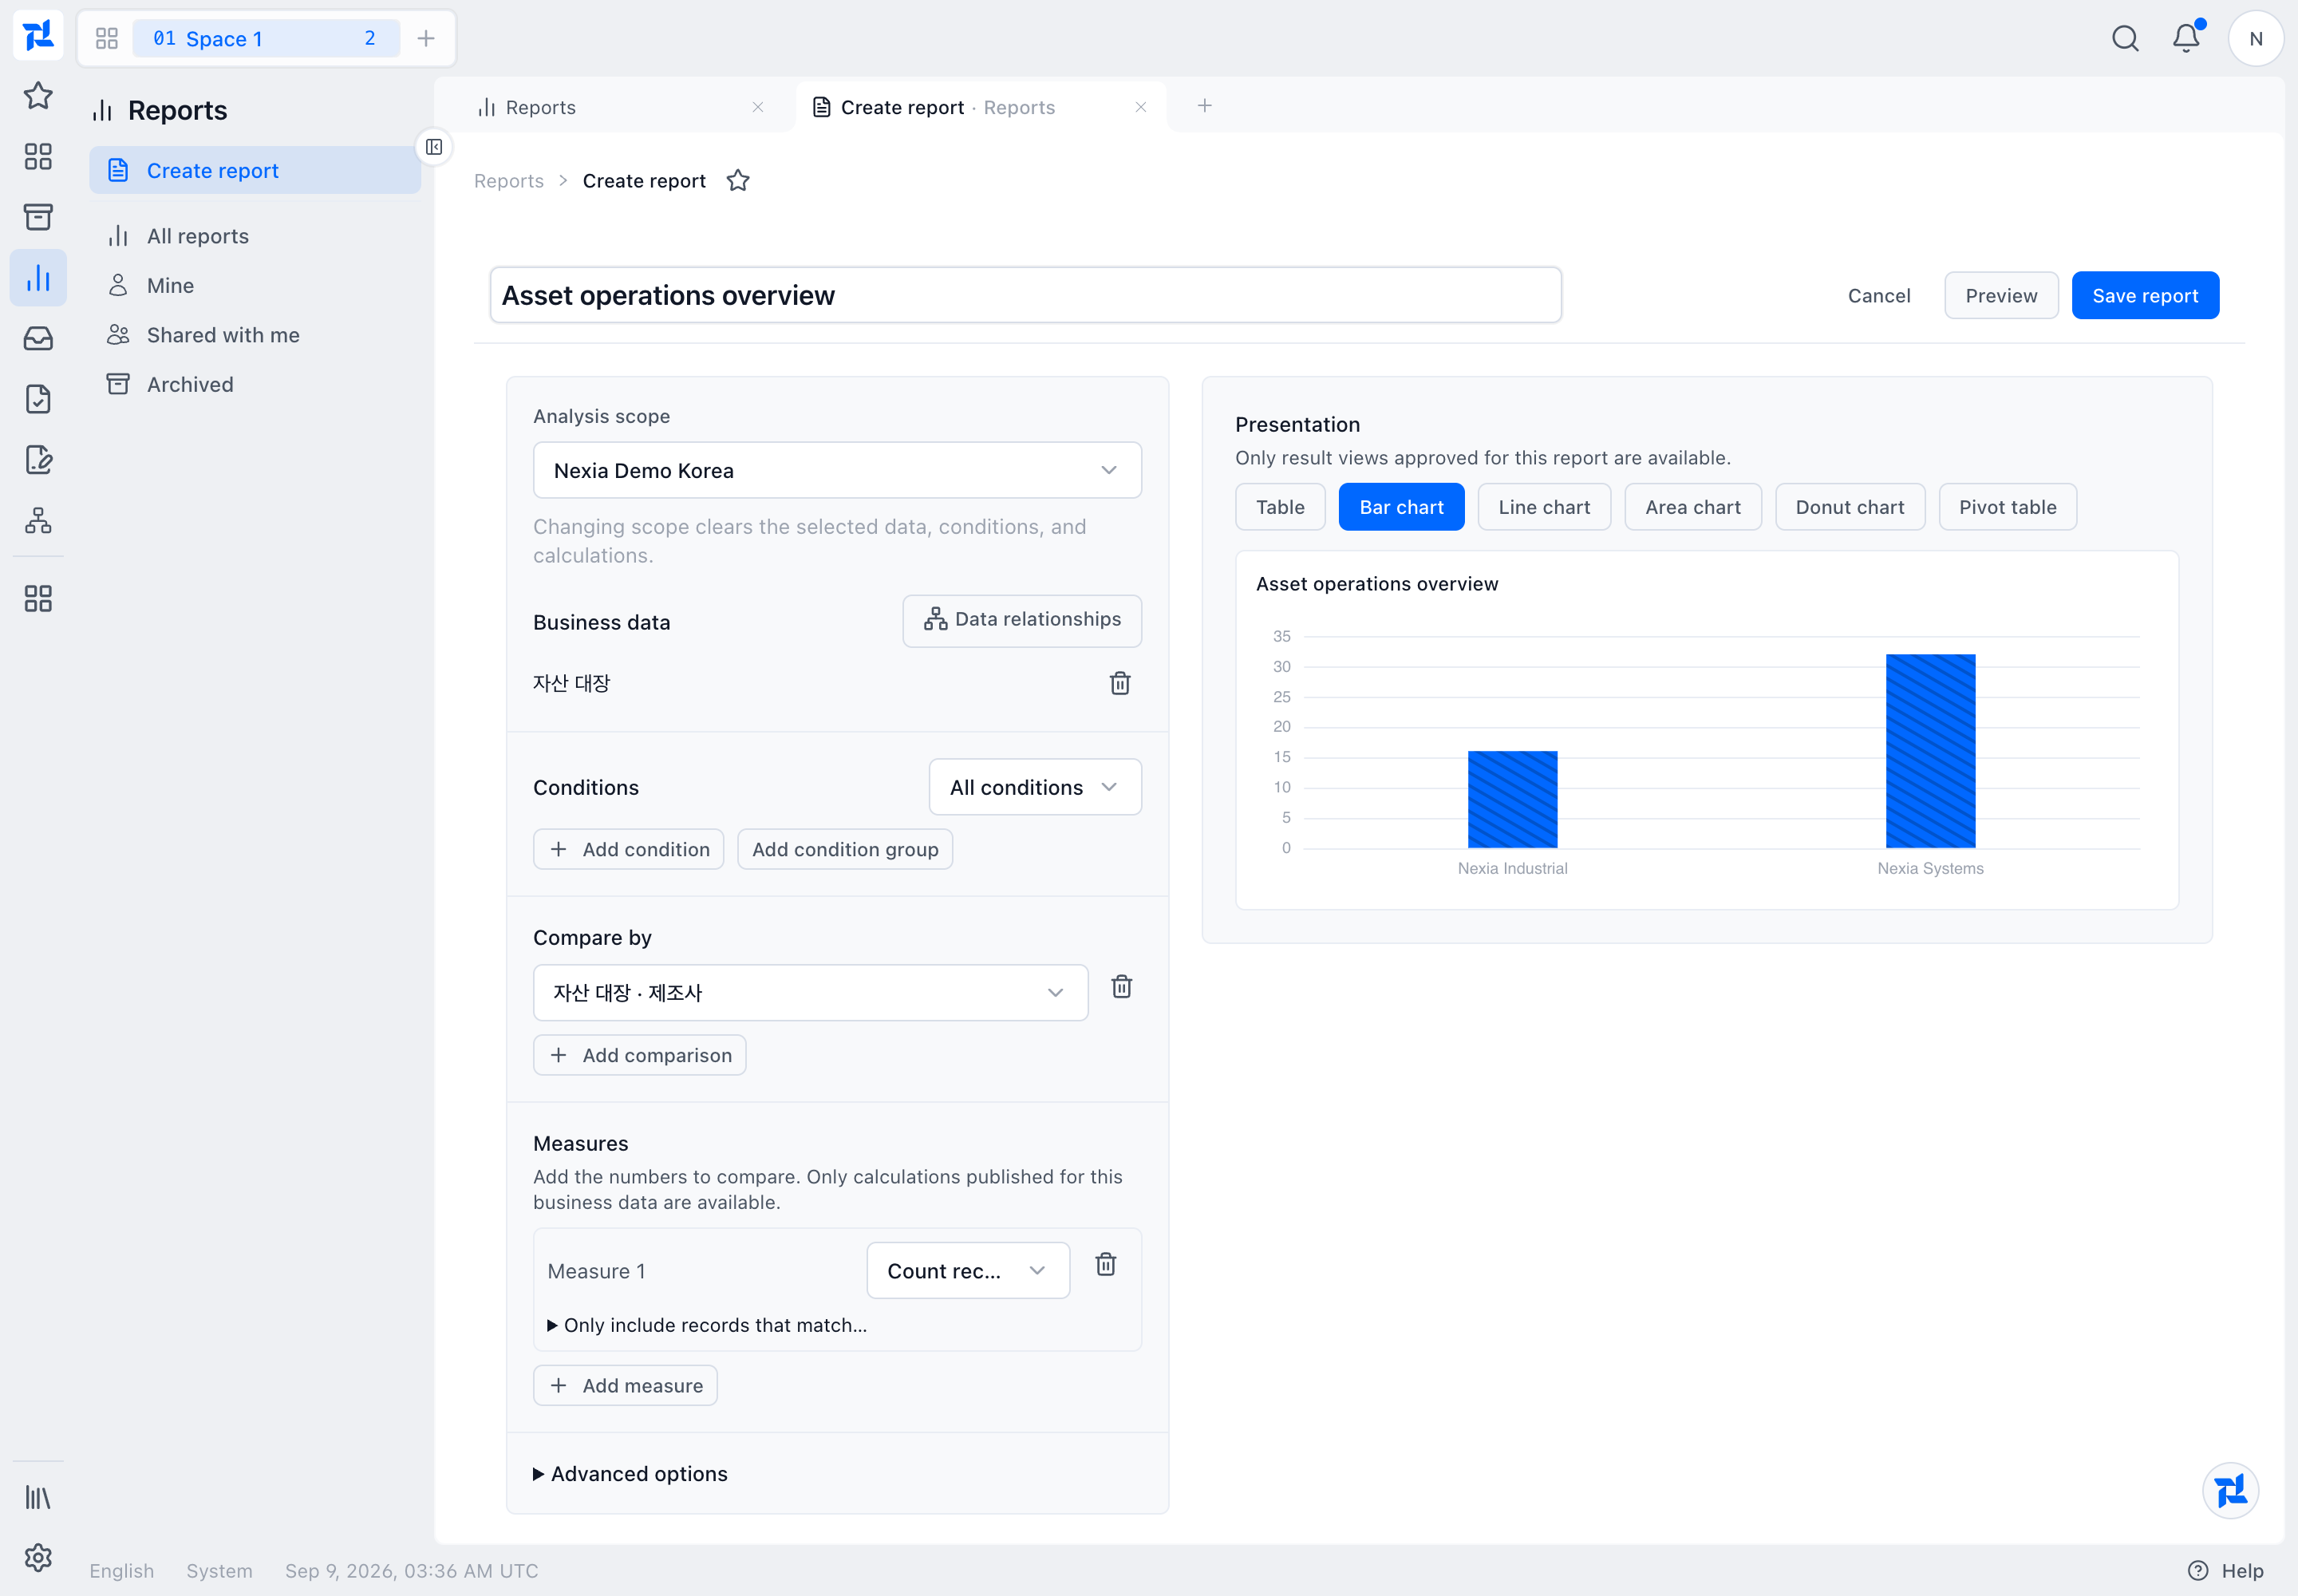
Demo report builder. Use your own accessible data and organization.
Saving creates a saved definition and revision; it does not save a snapshot of the displayed rows. The reopened report runs its saved definition against the data you can access at that time.
Reopen and use the saved report
Return to Reports and select the title to reopen the saved result. Use Edit to change the saved definition when you have edit access.
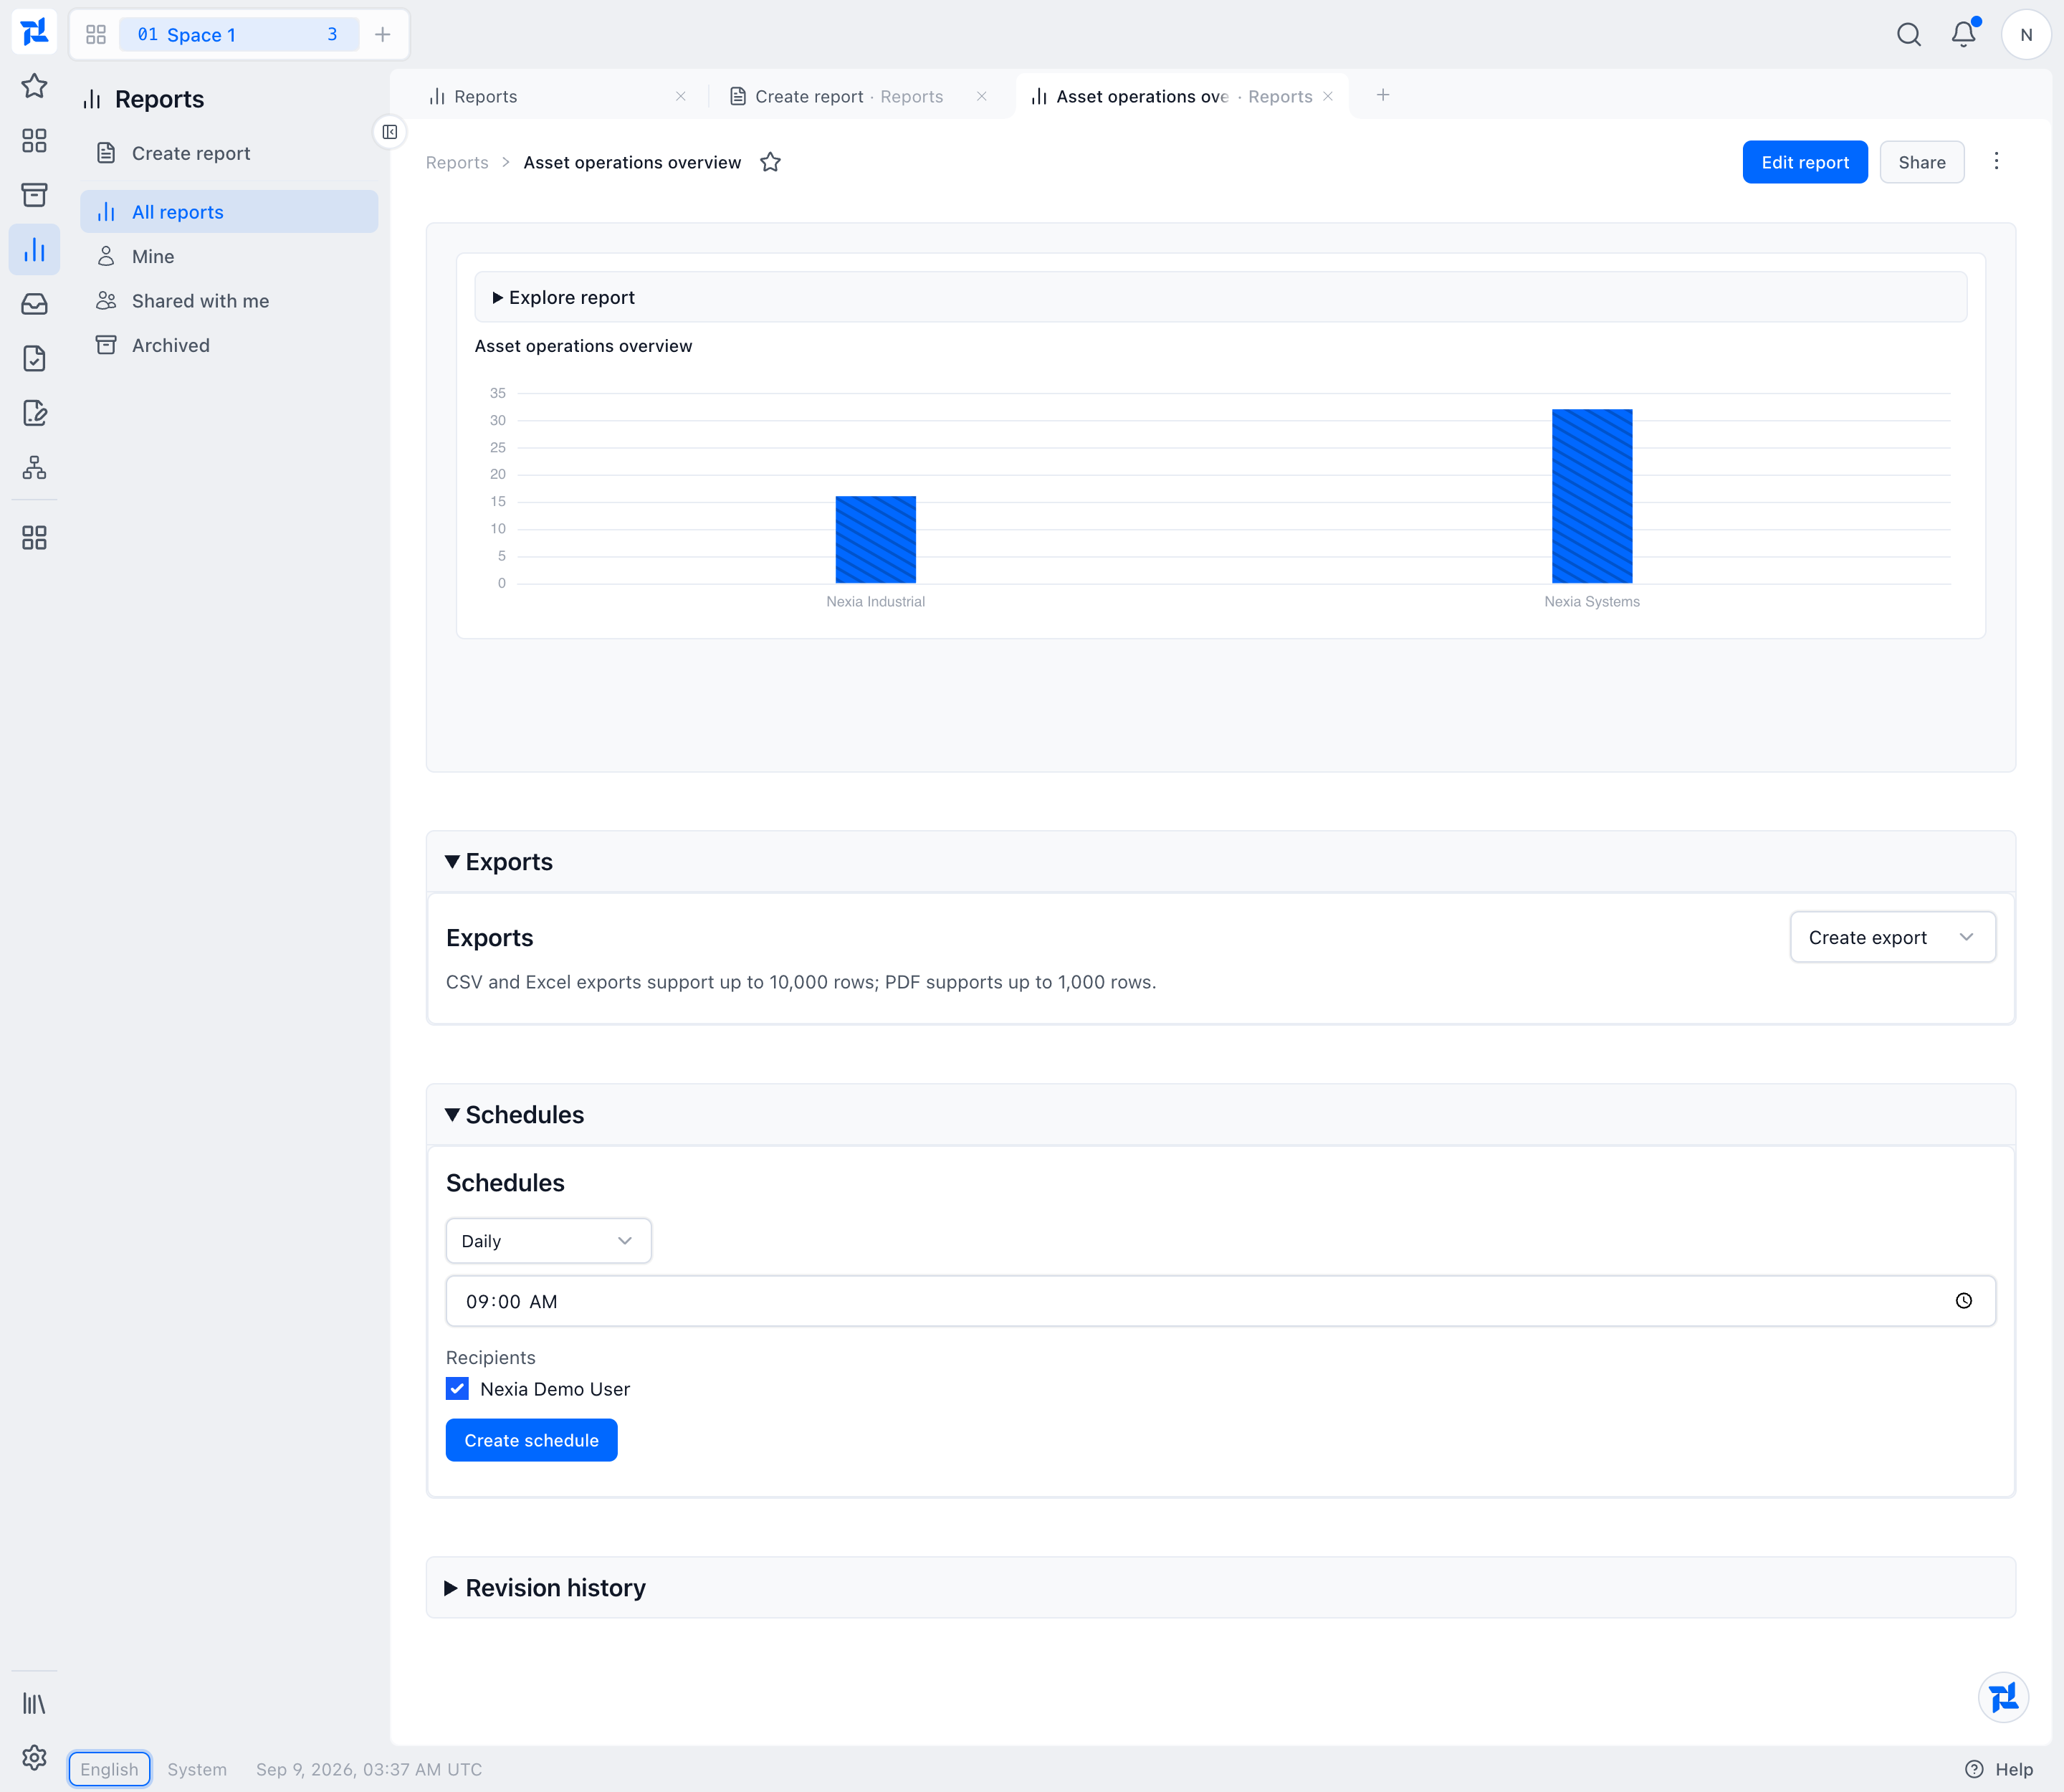
Demo saved report detail. Names and values are demonstration data.
When Share is available, select people and choose Can view report or Can edit report, then choose Save sharing. Open Exports, select CSV, XLSX, or PDF, and wait for its status to become completed before choosing Download. In Schedules, choose Create schedule, then choose daily, weekly, or monthly frequency, the local time, any required day, recipients, and Save schedule. The schedule uses your browser timezone automatically.
Reuse it on a dashboard
Open or create a dashboard and open its widget palette. Select the Reports tab, choose a ready saved report, and use Add to place it. Choose Save layout to keep the dashboard change. The dashboard pins the selected report revision, while its live results still follow the saved definition and current data access; adding it does not create a snapshot.
Reopen the report from Reports and the dashboard from My dashboards to confirm the title, saved definition, and placed widget are the ones you intended.
For the rest of the board workflow, see Build a dashboard directly.
If something goes wrong
If a source or report is unavailable, read its status and check access, the selected Legal Entity, and whether the source is installed. If a preview is empty, verify the filters and source data before assuming there are no matching records.
More guides for this capability
Nexia Cloud OS
Build and reuse a report
Create a saved data view and reuse it on dashboards.